Working with Tables (storing and entering data)
Store structured data in typed columns and enter it through the grid, a CSV import, a public form, or by asking an agent, then view, group, link, and automate it.
Tables are where your workspace keeps structured data: leads, deals, contacts, inventory, applicants, anything that fits rows and columns. A table is not a spreadsheet you babysit. It is a shared, typed store that you and your agents both read from and write to, that other surfaces (reports, dashboards, and the Today view) build on, and that can trigger an agent the moment a row changes. This article is the map of the whole Tables feature: what a table is, how to make one, how to get data in, and where to go next for each capability.
The mental model
Every table has a schema: an ordered list of columns, each with a name and a type. The type is the contract. A number column stores numbers and right-aligns them; a date column stores dates and sorts chronologically; a select column stores one of a fixed set of options and renders as a colored pill; a bool column is yes/no. There are also relational and computed types (link, lookup, rollup, formula) and a file type whose cells hold uploaded attachments. Because the type is enforced on every write, a value that does not fit is either gently coerced (and the change is reported to you) or set aside as quarantined for review, so a bad import never silently corrupts a column.
Rows carry the data plus a little provenance: when they were created, and whether an agent run created them. That provenance is what lets the grid tell you "12 of these rows were added by agent runs" and what powers the row detail panel.
Where tables live
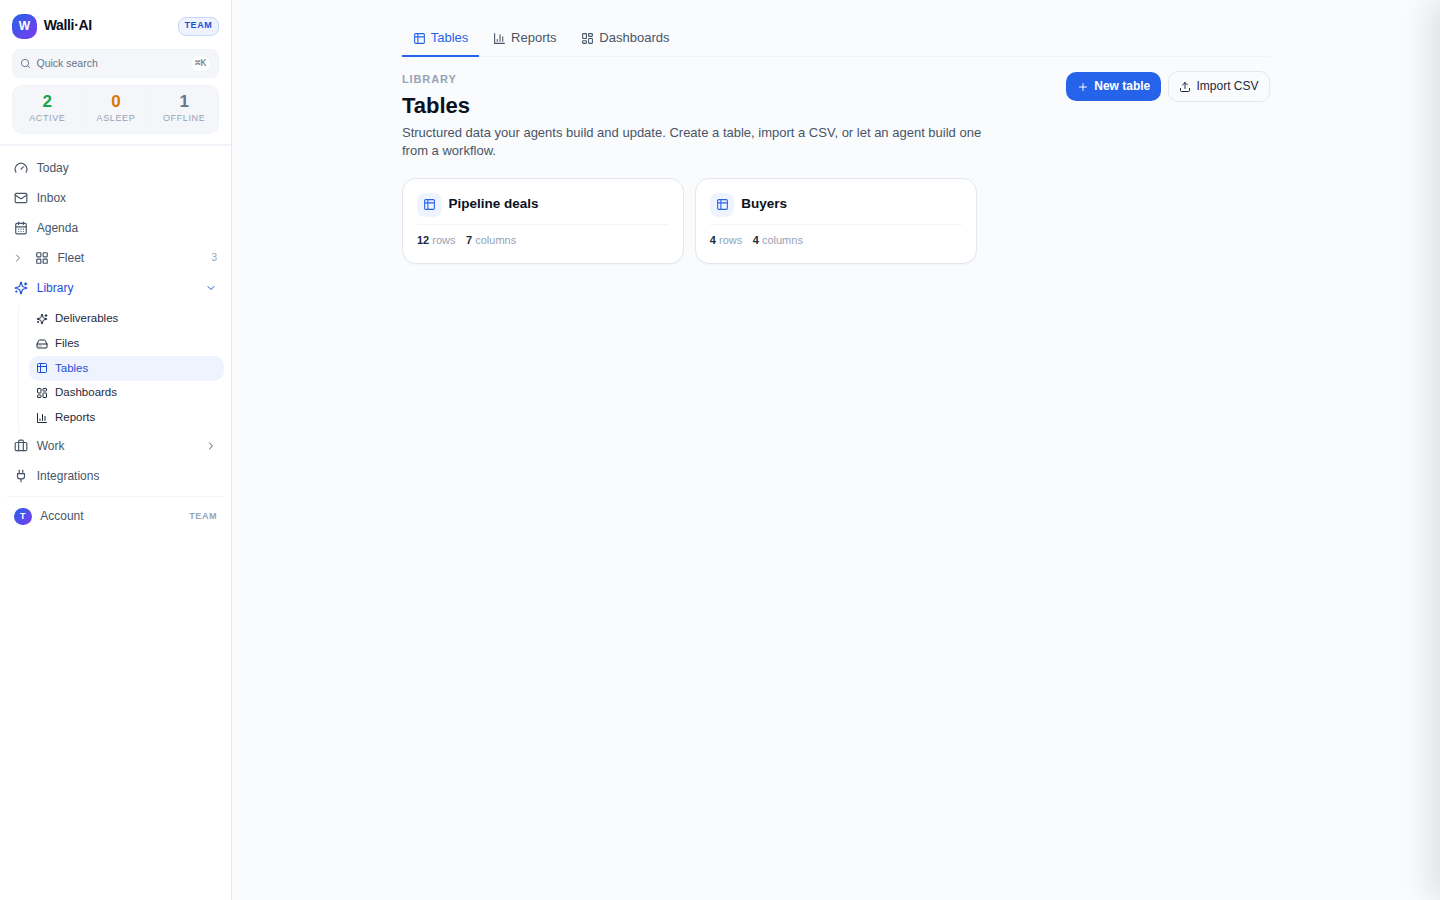
Find tables under Library -> Tables (/tables). The index lists every table in your workspace as a card showing its name, row count, and column count, plus a badge when a table has schema changes waiting for your review.
Create a table
There are three ways to start a table, and you will use all three over time:
- New table. Click New table, type a name, and you get an empty table you can shape by adding columns.
- Import CSV. Click Import CSV and pick a file. Walli-AI reads the header row to create the columns (inferring each column's type from its values) and loads the rows in one pass. This is the fastest way to stand up a populated table. See Importing and exporting.
- Ask an agent. Tell an agent "set up a table for tracking X" and it proposes a schema and creates it. Agents can also create a table implicitly the first time they need to write structured output.
The table workspace
Open a table (/tables/{id}) and the default view is the Grid: a spreadsheet-style layout with every column as a header across the top and inline cell editing. Add a row with New row, edit any cell by clicking it, and the change saves in place. Along the top you get Export, an overflow menu with Import CSV and Delete table, and a live count of rows and columns.
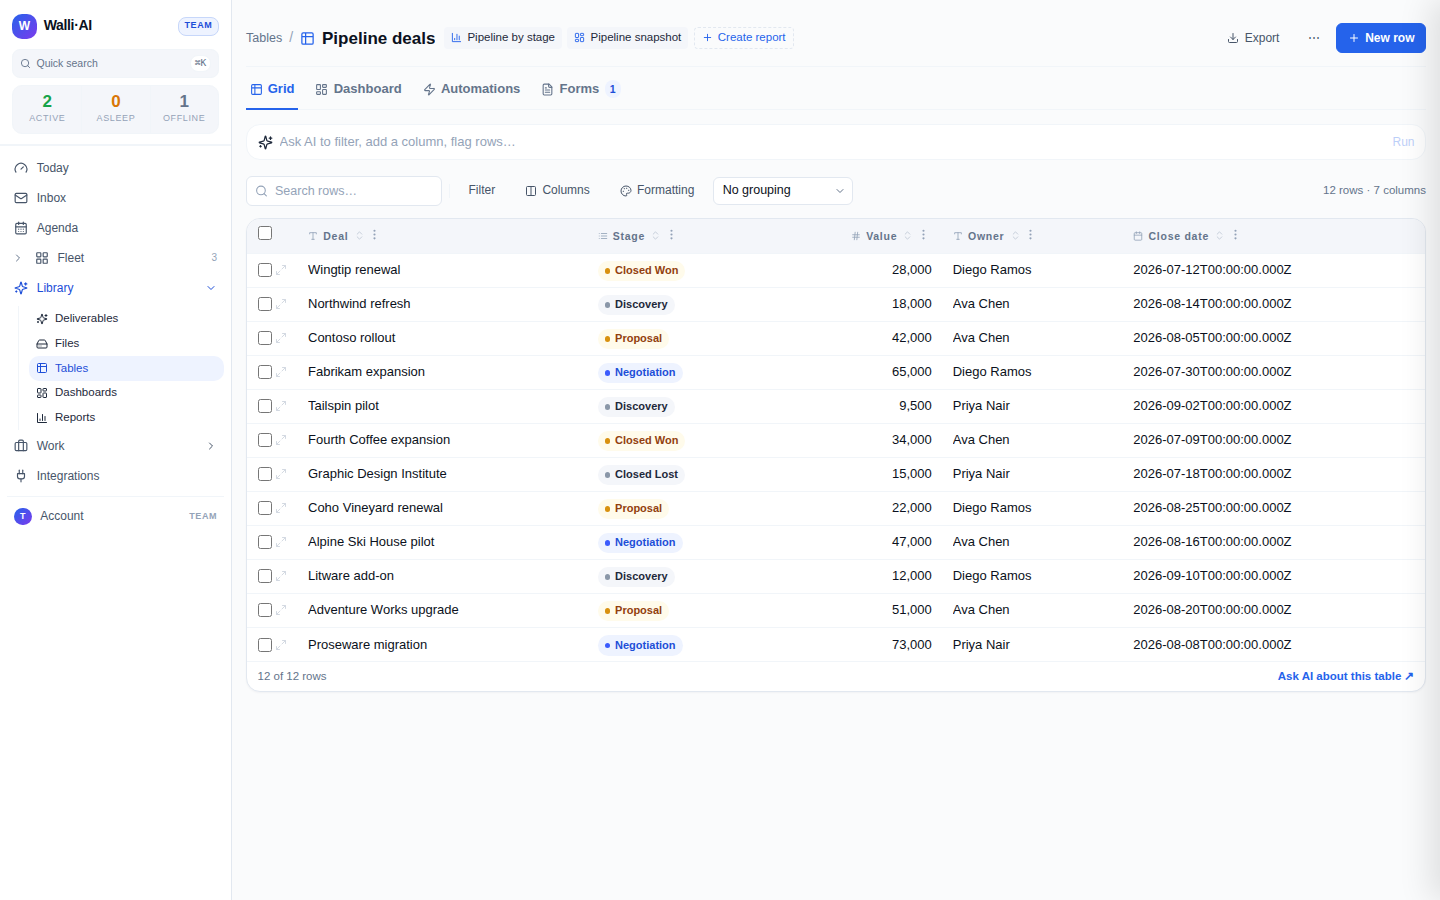
The workspace is organized into four tabs, each a first-class surface rather than a read-only view:
- Grid is the data itself, with search, filtering, grouping, and saved views.
- Dashboard pins chart tiles built over this table. See Dashboards.
- Automations runs an agent when rows change or on a schedule. See Table automations.
- Forms exposes a public intake form that writes rows into the table. See Public forms.
Above the grid sits an AI command bar ("Ask AI to filter, add a column, flag rows...") that turns plain English into grid operations, and a command row that links out to any reports, dashboards, and automations connected to this table so you always know what a table feeds before you change or delete it.
Column types at a glance
When you add a column (through the Columns panel or by asking an agent) you pick from these types:
- text, number, date, bool are the plain scalar types.
- select stores one of a fixed option set and renders as a pill; it is the only kind of column you can group a grid or a kanban board by (alongside
boolandlink). - link points a row at a row in another table. lookup pulls a field from a linked row, and rollup aggregates rows on another table that link back to this one. formula computes a value from other columns in the same row. These four are covered in Linking tables.
- file holds uploaded attachments on the row.
Columns can be renamed, retyped, reordered, hidden, and deleted from the column header menu or the Columns panel. When an agent proposes a schema change (for example, a new column inferred from an import), it lands in a Schema review card you approve or reject, so agents never silently reshape your data.
What to read next
This cluster covers each capability in depth:
- Views: grouping, kanban, and saved views : reshape the grid, group by a column, drag cards between kanban lanes, and save a view you return to.
- Linking tables : link records across tables, pull fields with lookups, and roll up totals.
- Table automations : run an agent when a row is inserted, updated, or deleted, or on a schedule over the table.
- Importing and exporting : CSV import (new table or append), export, and how row limits work.
- Letting an agent enter and query data : add, update, and answer questions from a table conversationally.
- The row detail panel : one row's fields, who links to it, which run created it, and what has happened to it.
- Public forms : collect rows from people outside your workspace.
Sharing and isolation
Tables belong to your workspace. Row data is isolated per tenant at the database layer (row-level security in the backing Postgres store), so one workspace can never read another's rows even by guessing an id. Rows written through a public form are tagged as external so an agent treats that input as untrusted. Row storage counts toward your plan; when a table reaches its row limit, adding more rows is blocked with a prompt to upgrade or delete rows, and you can see the limits for each plan on the billing page.