Table views: grouping, kanban, saved views, sorting, and filtering
Reshape a table without changing its data: sort, filter, search, group into sections, switch to a kanban board, save the view, and color rows with formatting rules.
A view is a lens over a table. It changes how rows are ordered, filtered, grouped, and rendered, but never the underlying data. This article covers everything you can do to reshape a table's Grid tab: sort and filter, search, group rows into sections, switch to a kanban board and drag cards between lanes, save a view you return to, and color rows with conditional formatting.
Sort, search, and filter
Every column header carries a menu (the vertical dots) with Sort ascending and Sort descending; sorting is by the column's type, so a number column sorts numerically and a date column chronologically, not alphabetically. The Search rows box does a debounced text match across the table and narrows the grid as you type.
The Filter button opens a condition builder. A filter is a group of conditions joined by AND or OR, and each condition names a column, an operator, and a value. Operators are type-aware: text columns offer contains / starts with / ends with / is empty, number and date columns offer the comparison and range operators (greater than, between, before, after, last N days, this month, this quarter), and bool columns offer is true / is false. A filter with any active condition stays visible so you always see why rows are hidden, and the row count in the corner reflects what the filter is actually showing.
Group a grid into sections
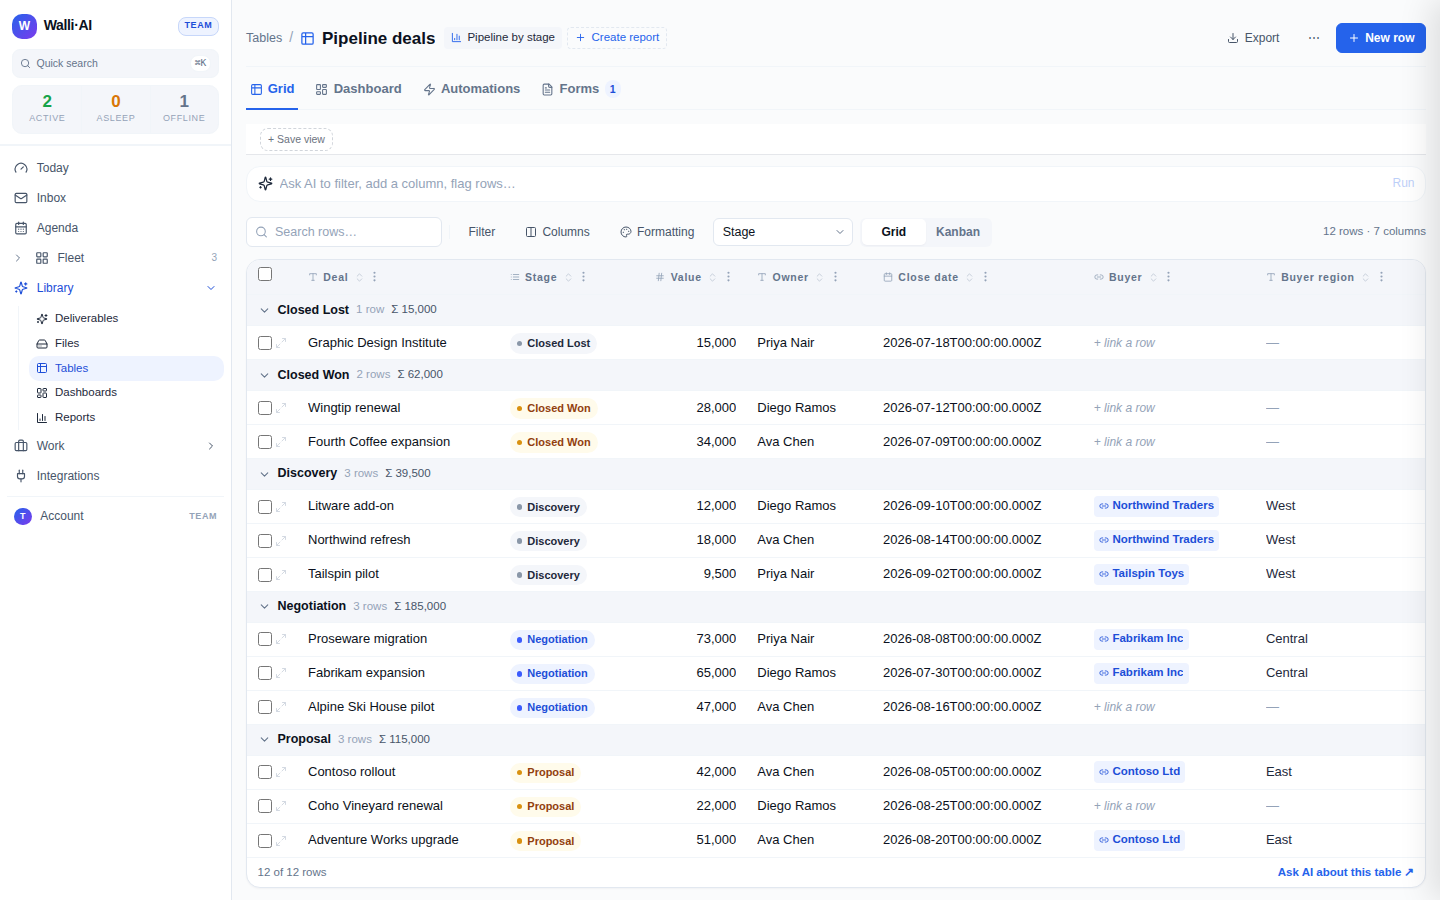
Pick a column in the Group dropdown and the grid splits into labeled sections, one per distinct value, each with its own header showing a count (and a sum, when the table has a number column). Only three column types can be grouped: select, bool, and link. The reason is deliberate: grouping doubles as the axis you can drag cards along in kanban, and a kanban drag has to be able to write the new value back into the cell, which is only meaningful for those three types. Computed columns (lookup, rollup, formula) are read-only and never groupable.
The per-group counts and sums are computed on the server against the same filter and search you have active, so the numbers in the group headers never disagree with the rows on screen.
Switch to a kanban board
Once a groupable column is chosen, a Grid / Kanban toggle appears. Kanban renders each group as a vertical lane and each row as a card. For a select or bool group-by, the board is fully interactive: every option becomes a lane (even options with no rows yet, so there is always somewhere to drop a card), and dragging a card from one lane to another writes the new value into that cell. Dropping a card back on its own lane does nothing, and a plain click opens the row instead of starting a drag.
A link group-by is shown as a read-only board: relationships are not reassigned by dragging, so link cards are not draggable and a short note says so. Each card shows the row's title (its first text field) plus up to three other fields, and each lane header carries the same live count and sum as the grouped grid.
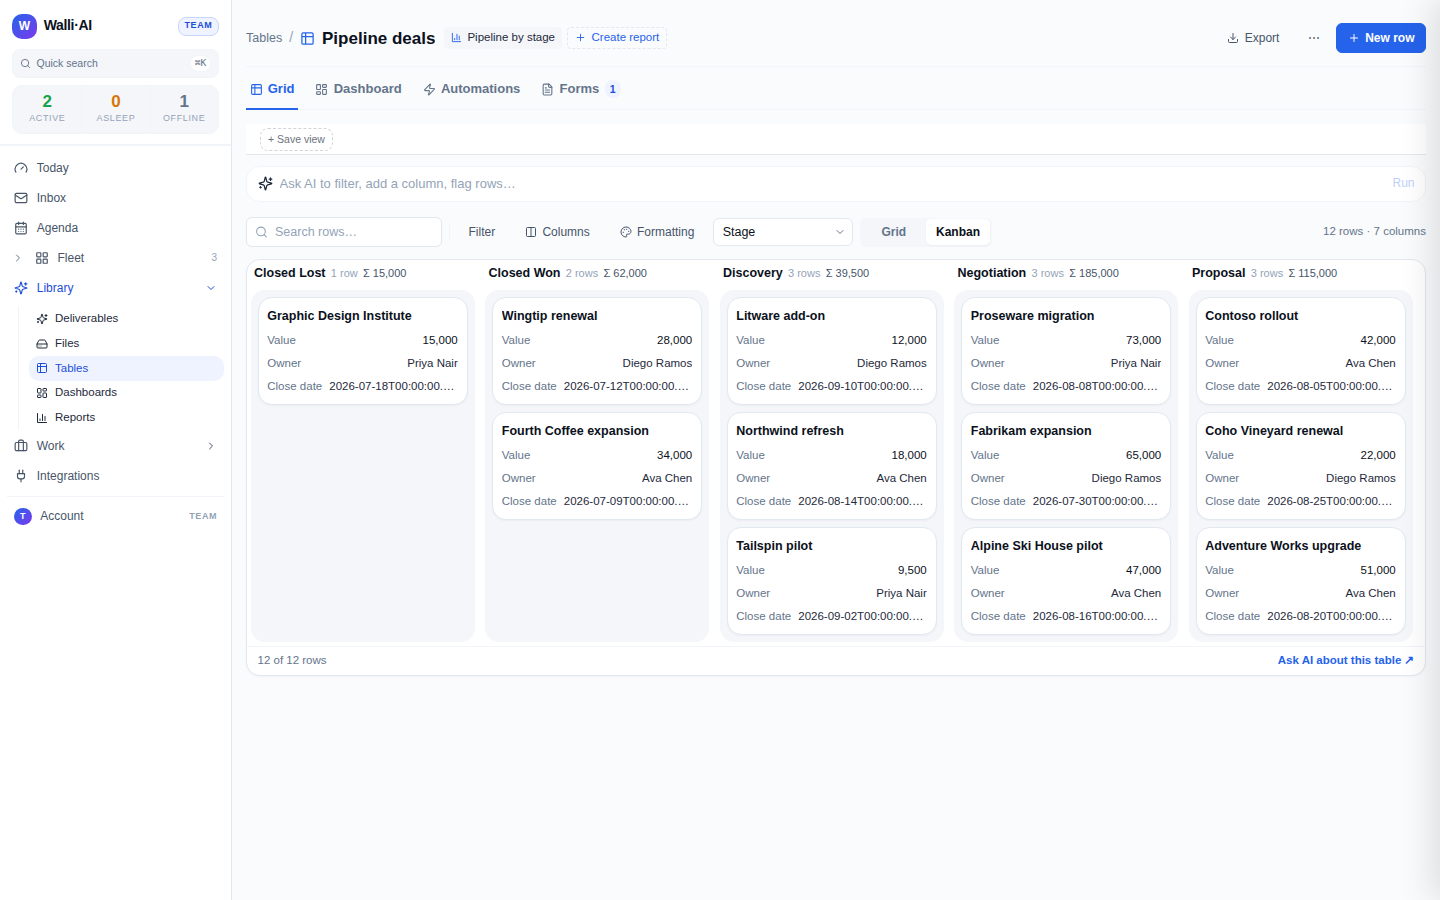
Because a kanban lane move is just a cell write, it fires the same row-change automations a grid edit would. If you have an automation set to run when the stage column changes, dragging a card into the "Closed Won" lane triggers it. See Table automations.
Save a view
Any combination of filter, sort, search, visible columns, group-by, and grid-versus-kanban can be saved as a named view. Use Save view in the saved-views bar, give it a name, and it becomes a tab you can click to reload that exact configuration later. Views can be renamed and deleted inline. When you have a saved view loaded and then change something (add a filter, regroup), a small amber dot appears next to the view to tell you the current state no longer matches what you saved, so you never lose track of unsaved tweaks. A saved kanban view reloads as a kanban board; older views saved before kanban existed reload as a grid.
Show, hide, and reorder columns
The Columns button opens a panel that lists every column with a drag handle and a visibility checkbox. Drag to reorder (the order is the left-to-right order in the grid and the top-to-bottom order in the row detail panel), and uncheck a column to hide it from the default view without deleting it or its data. You can also hide a column straight from its header menu. Reordering and hiding are display settings: they do not bump the table's schema version or touch any row.
Color rows with conditional formatting
The Formatting button opens a panel where you add rules that tint rows or cells based on their values. A rule has a when condition (the same AND/OR condition shape as a filter), a target (the whole row, one specific cell, or just the cell's text), and a tone (neutral, warn, active, success, or danger). Rules are applied top to bottom, first match wins, and a table can hold up to five of them. Formatting is evaluated on the client over the rows already loaded, so turning a rule on or off is instant and never refetches data. Use it to make overdue rows read red, won deals read green, or a status cell stand out, all without changing a single value.
What stays put
None of these controls change your data. Sorting, filtering, grouping, hiding columns, saving views, and formatting are all presentation. The one control here that does write data is a kanban drag, and it writes exactly one cell: the group-by value of the card you moved. Everything else is a lens you can add and remove freely.