Reports overview: structured, deterministic reports over your tables
Turn a table into a filtered or summarized report whose figures are computed by a deterministic engine and never estimated, then preview, export, schedule, or hand it to an agent.
A report is a saved question over one of your Tables: which rows, which columns, grouped how, totaled how, drawn as what chart. Ask it once, save it, and you can re-run it any time to get the current answer, export it to a file, schedule it to deliver, or drop it on a dashboard. The single most important thing about reports is that every number they produce is computed by a deterministic engine over your real rows. Figures are never estimated, guessed, or written by a language model.
This article is the map of the reports feature. It explains what a report is and why its numbers are trustworthy, tours the Reports index, and points to the two sibling articles that go deep on building and on running, exporting, scheduling, and deleting.
Why the numbers are trustworthy
When you run a report, the platform loads the matching rows from your table and runs a fixed computation pipeline over them: apply the filter, group the rows, compute each aggregate, sort, and limit. That pipeline is ordinary deterministic code (the computeReport engine), not a model prompt. A sum is an actual sum of the cells; a count is an actual count of rows. The same report over the same data always returns the same figures.
This matters because agents can present report results in chat and in deliverables. The rule the platform enforces is strict: any total, count, average, or percentage over table data must come from running the report, never from an agent doing mental math. If a figure could be fabricated, it is not allowed to be. When a report's underlying table has changed shape since the report was saved (a referenced column was renamed or retyped), the engine flags that drift on the result rather than quietly returning a wrong number.
The Reports index
Go to Library -> Reports (/reports) to see every saved report. Each report is a card showing its name, the table it is built on, and whether it produces Rows (a filtered row list) or Totals (a grouped summary). Where a report defines a chart, the card renders a live thumbnail of that report's own current answer, so the index doubles as a small at-a-glance dashboard. Cards load their previews lazily and fall back quietly if one cannot be drawn, since a thumbnail is decoration and never blocks the page.
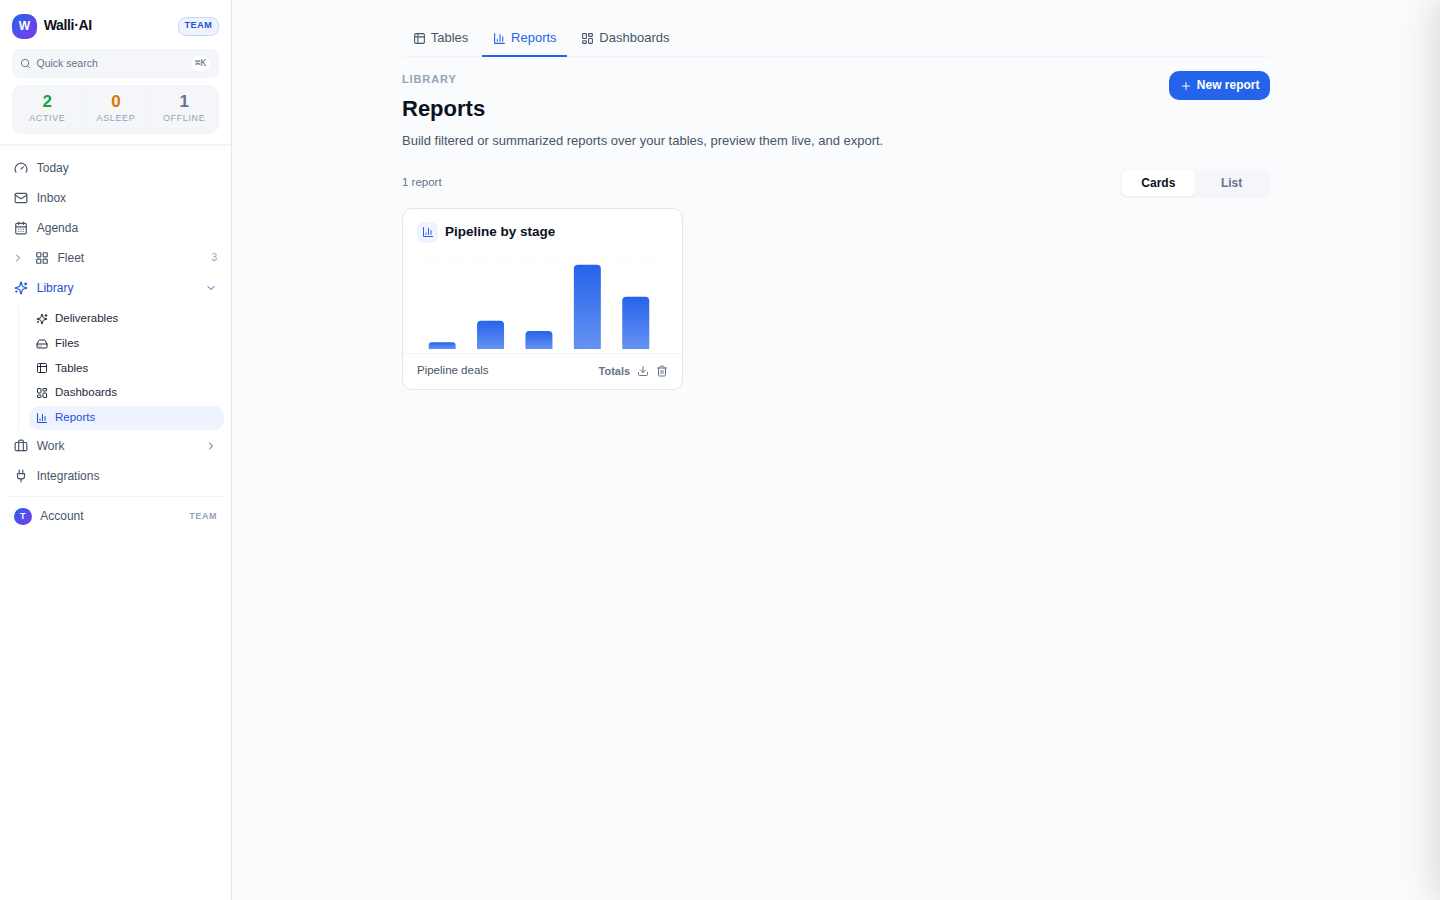
From the index you can:
- Open a report to build, preview, export, schedule, or delete it (that opens the report builder, covered below).
- Quick-export to CSV straight from a card or list row without opening the report.
- Delete a report, which also stops any scheduled deliveries bound to it.
- Switch between the Cards and List views with the toggle.
- Create a new report with New report, or describe one in plain language and let the platform draft it over your table.
If you have no reports yet, the empty state lets you describe the report you want ("count of deals by stage as a bar chart") and drafts a starting spec for you to refine.
The two things you do with a report
Everything else about reports splits into two jobs, each with its own article:
- Building a report covers picking the source table, choosing rows-versus-totals, selecting columns, adding filters, grouping and aggregating, joining to a linked table, drawing a chart, and reading the live preview. See Building a report.
- Running, exporting, scheduling, and deleting covers the export formats (PDF, XLSX, DOCX, HTML, CSV, Markdown, text), scheduled delivery to email or a channel, adding a report to a dashboard, and how deleting a report cascades to its delivery schedules. See Sharing and exporting reports.
Handing reports to an agent
Reports are not just a screen; agents have a matching set of tools so they can work with the same engine:
report_listlists the saved reports (id, name, mode, source table) so an agent can discover what already exists before building something new.report_run(reportId)runs a saved report and returns the deterministically computed headers, rows, totals, and chart data. An agent cites these exactly and never recomputes them.report_create(...)saves a new report definition over a table, in detail or summary mode, with optional filters, grouping, aggregates, and a chart.report_export(reportId, format)renders a report to a file and returns a download link. The link is the deliverable an agent pastes or attaches; it never pastes raw file bytes.
So when you ask an agent "give me a spreadsheet of open deals by stage" or "what is the total pipeline value this quarter," the agent runs or exports a report and reports back exactly what the engine returned. This is the same guarantee the UI gives you, extended to conversational and scheduled work.
When a report is the right tool
Use a report when the thing you want is structured data from a table: a filtered list, a grouped total, a trend, a spreadsheet, a formatted PDF of figures. Use a dashboard instead when you want several of those answers on one always-on canvas across more than one table. Use an agent-produced file when the output is prose, media, or a rendered document rather than table figures. Reports, dashboards, and files all live under the Library, and a report can feed a dashboard widget, so these are complementary rather than competing.
Tips
- Name reports for the question they answer ("Open pipeline by stage") rather than the table, so the index reads like a list of answers.
- If a report's numbers look stale, remember they reflect the table's current rows every run; refresh the table data, not the report.
- A report flagged for schema drift is telling you its table changed; reopen it in the builder and re-point the affected column.
- Prefer a saved report over asking an agent to compute figures ad hoc: the saved report is reusable, exportable, and schedulable, and its numbers are guaranteed to come from the engine.