Building a report: columns, filters, groups, and computed totals
Build a report step by step over a table: pick rows or totals, choose columns, filter, group and aggregate with a deterministic engine, join a linked table, chart the result, and watch a live preview.
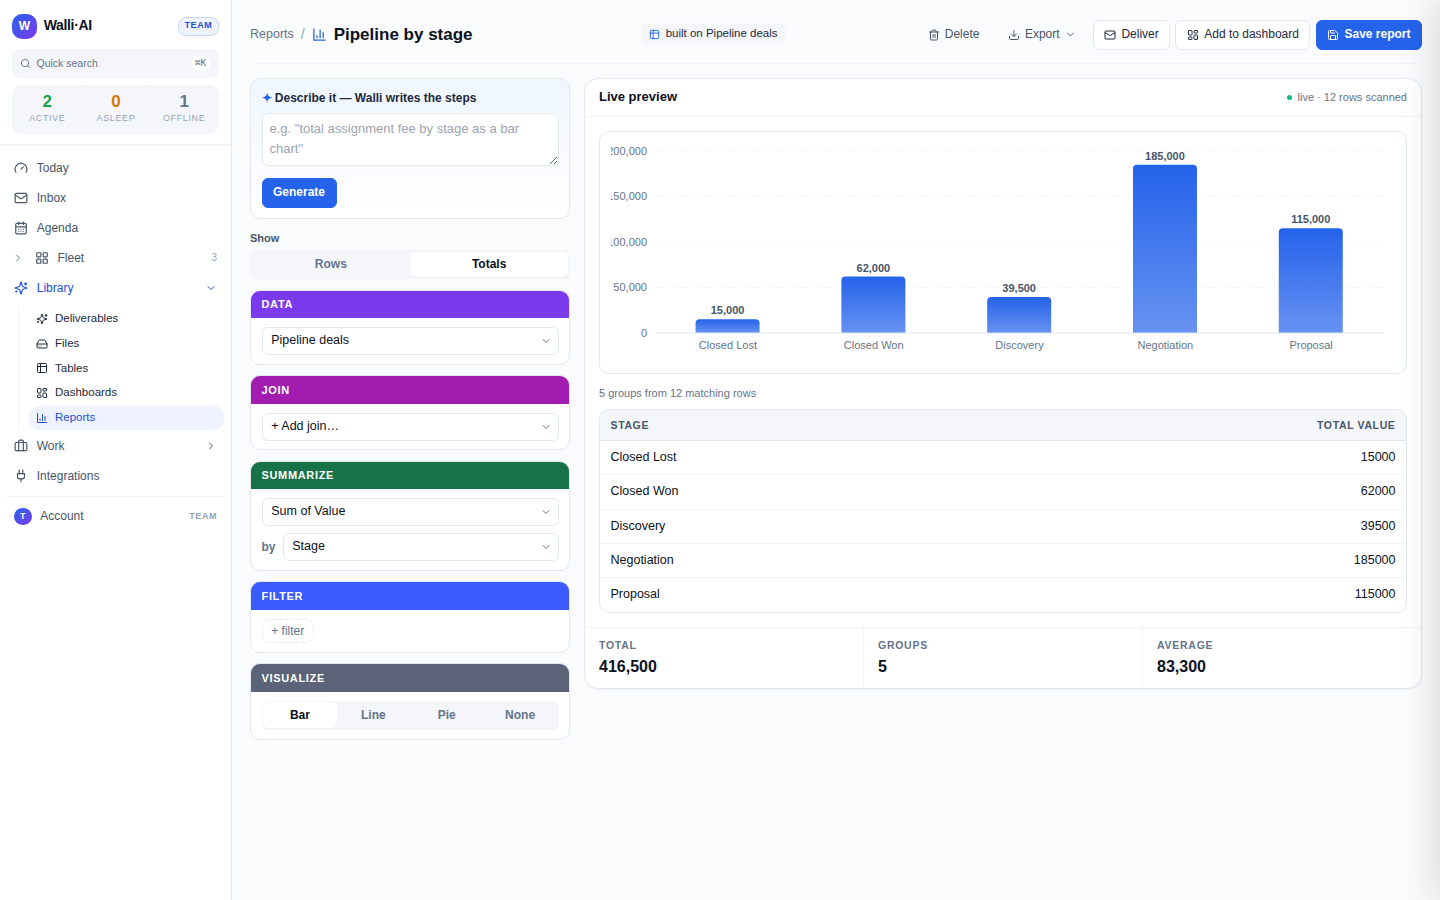
The report builder is where you turn a table into a saved answer. It is laid out as a column of steps on the left (a notebook) and a live preview on the right that updates as you change the steps. This article walks each step: choosing the data, deciding between rows and totals, selecting columns, filtering, grouping and aggregating, joining to a linked table, drawing a chart, and saving. Throughout, remember that the preview and the saved report both run the deterministic engine, so the figures you see are the real figures, never estimates.
Open the builder from the Reports index by clicking a report, or start a fresh one with New report (/reports/new).
Describe it, or build it by hand
At the top of the notebook is a Describe it panel: type what you want in plain language ("total assignment fee by stage as a bar chart") and the platform writes the steps for you. It fills the same controls you would set by hand, so you can review and adjust everything it chose before saving. If your description is ambiguous it asks a clarifying question instead of guessing. You never have to use it; every step below is fully editable directly.
Step 1: Data
The Data step picks the source table. A report reads exactly one base table (joins, below, reach one level past it). Selecting the table is what unlocks the rest of the notebook and the preview. If you arrived from a table's own screen, the source is pre-selected for you.
Step 2: Rows or Totals
The Show toggle sets the report's mode:
- Rows (detail mode) returns the matching rows themselves, with the columns you choose. This is a filtered list.
- Totals (summary mode) groups the rows and computes aggregates over each group. This is a summary.
The rest of the notebook changes to match: Rows mode shows a Columns step, Totals mode shows a Summarize step and a Visualize step.
Step 3a (Rows): Columns
In Rows mode, the Columns step is a set of toggles, one per column. Click to include or exclude a column; leave them all on to show everything. The order the engine returns them follows the table. Excluding a column here only drops it from the report output, it does not touch the table.
Step 3b (Totals): Summarize
In Totals mode, the Summarize step has two controls:
- Measure is what you compute: Count of rows, or Sum of a number column. Count needs no column; a sum acts on the number column you pick.
- by is the group column. Pick a column and the engine produces one row per distinct value with the measure computed for that group. Leave it at (none) for a single grand total.
Under the hood the engine supports more aggregate functions than the quick picker exposes (count, count-distinct, sum, average, min, max); the visual builder wires up the two most common (count and sum) while the natural-language describe path and the agent report_create tool can set any of them.
Step 4: Filter
The Filter step decides which rows count. Add a condition with + filter, then pick a column, an operator, and a value. The operators available in the builder are: equals, not-equals, contains, greater-than, less-than, greater-or-equal, less-or-equal, is-empty, and is-not-empty (the is-empty and is-not-empty operators take no value). Conditions are combined together, and a half-built condition with no column chosen yet is simply ignored until you complete it, so the preview never breaks while you are still typing. The filter is applied first in the pipeline, before grouping and aggregating, so your totals are totals of exactly the rows that match.
Step 5 (Totals): Visualize
In Totals mode a Visualize step chooses the chart drawn from the grouped result: Bar, Line, Pie, or None. The chart plots the group column on the X axis and the measure as the series. The chart is part of the saved report, so it shows on the Reports index thumbnail, in a dashboard widget built from the report, and in exports that support images.
Joining a linked table
If your source table has a link column to another table, the Join step lets you pull that linked table's columns into the report, one level deep. Add a join on a link column and it gets a short alias; the joined table's columns then appear in the Columns, Summarize, and Filter pickers labeled with the alias. Only columns with a real stored value are offered from a joined table: plain text, number, date, boolean, and select columns. Computed columns (lookup, rollup, formula), link columns, and file columns on the joined table are deliberately not offered, because a join reads the joined row's stored cells directly and those types have no stored value to report on. There is a small cap on how many joins one report can have, and removing a join cleanly strips any references to it from the rest of the spec so you cannot leave a dangling column behind.
The live preview
The right side is a live preview that re-runs as you edit, after a short debounce. Its header shows how many rows the engine scanned for the current result, with a live indicator, so you can see the report is really executing against your data. In Totals mode a strip beneath the preview shows the overall total, the number of groups, and the average, all computed from the actual preview result and never fabricated. The preview is the report: what you see is exactly what an export or a scheduled delivery will contain.
Save
Save report persists the definition and, for a new report, gives it an id and takes you to its saved URL. From there you can export it, schedule delivery, add it to a dashboard, or delete it, all covered in Sharing and exporting reports. Saving records the table's schema version at the time, which is how the engine later detects and flags drift if the table changes shape.
Tips
- Start in Totals mode with a group column and a sum: it is the fastest way to a useful chart, and it drives the Reports index thumbnail.
- Build the filter first when you only care about a slice (open deals, this quarter): every total downstream is then a total of just that slice.
- Use the Describe it panel to rough out a report, then fine-tune the steps by hand; the two are the same spec, so switching between them loses nothing.
- If a joined column shows blank everywhere, it is a computed or link type that has no stored value across the join; report on the base table's own column instead.
- Watch the "rows scanned" indicator: if it is zero, your filter is excluding everything, which is a faster way to catch an over-tight condition than reading an empty table.