Turn a spreadsheet into a formatted xlsx analysis with charts
Ask an agent to analyze your data and it runs real Python in a sandbox over the rows you give it, writing back a formatted xlsx with computed tables and charts.
You have the rows, but what you need is the analysis: the pivot by category, the month-over-month change, the totals and the chart, laid out in a formatted spreadsheet you can send on. This recipe has an agent do that for you. You point it at a table or a file, ask for the analysis you want, and the agent writes and runs real Python over your data in a secure sandbox, then hands back a formatted xlsx with the computed tables and charts inside it. The math is done by code, not guessed by a language model, so the numbers are real.
Who this is for
Analysts, finance and ops people, and anyone who lives in spreadsheets and keeps rebuilding the same rollup by hand. It fits any dataset you can put in a Walli-AI table or upload as a file: a sales export, a transaction log, a survey dump, an inventory sheet. If "clean this up, pivot it, chart it, and format it" is a recurring afternoon, this turns it into a single request.
What you'll set up
An agent with the code sandbox tool, and the data staged in for it to work on. The agent has a code_run tool that executes Python in a secure sandbox with pandas, numpy, and openpyxl already installed. You give it the data by naming a table (its rows are staged in as a CSV) or an uploaded file; the agent writes code to analyze it and writes an xlsx to the sandbox's output folder, which lands back in your Library as a file you can download.
Build it
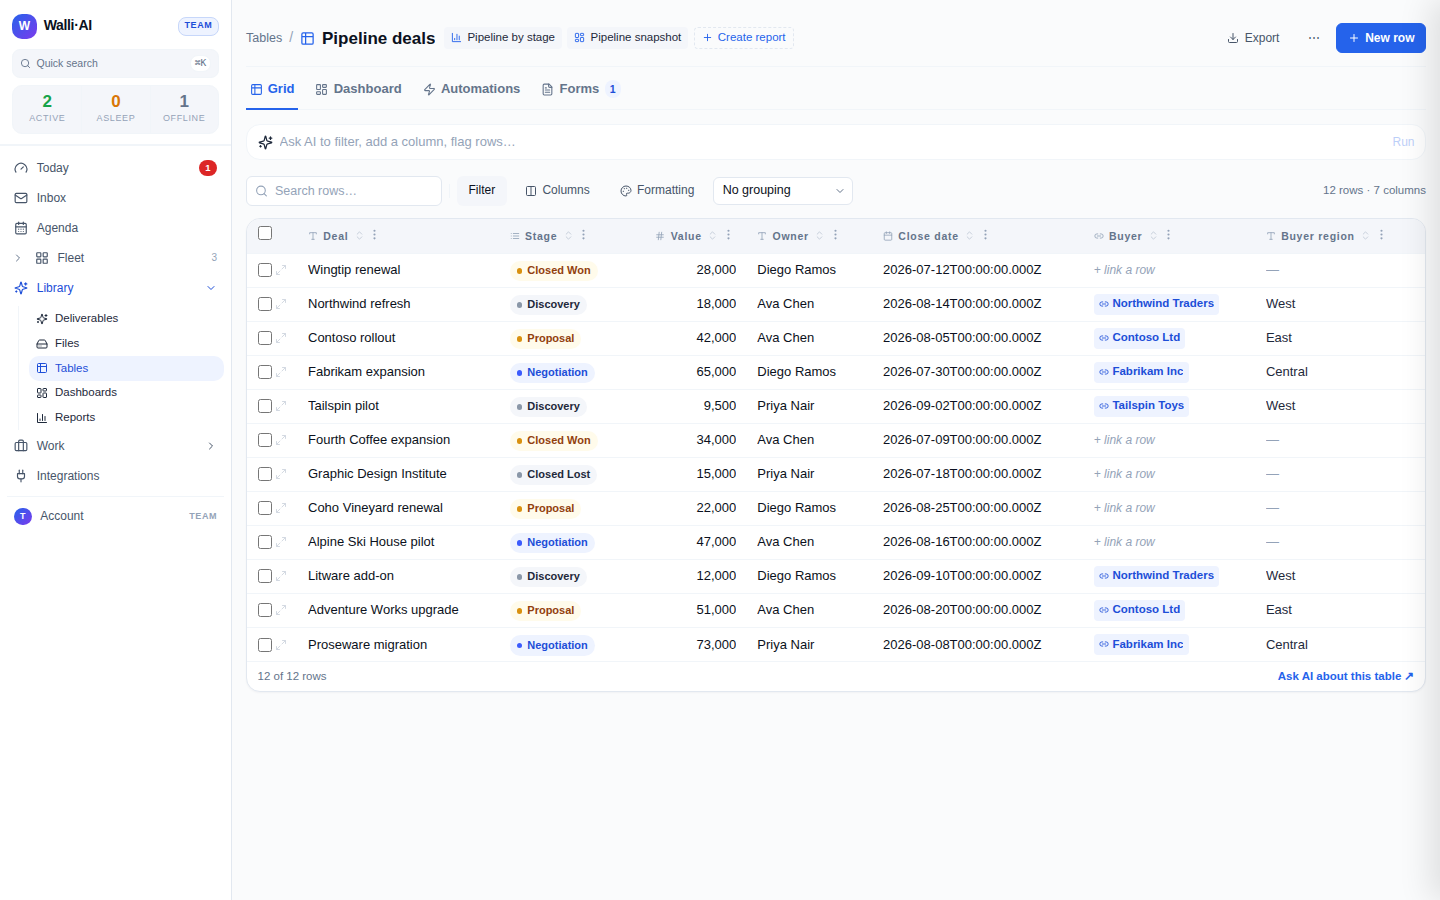
- Put your data where the agent can reach it: a table with one row per record, or a file uploaded to the agent's workspace. Either becomes the input the sandbox reads.
- Create an agent (or use an existing one) that has the code sandbox tool available. The sandbox
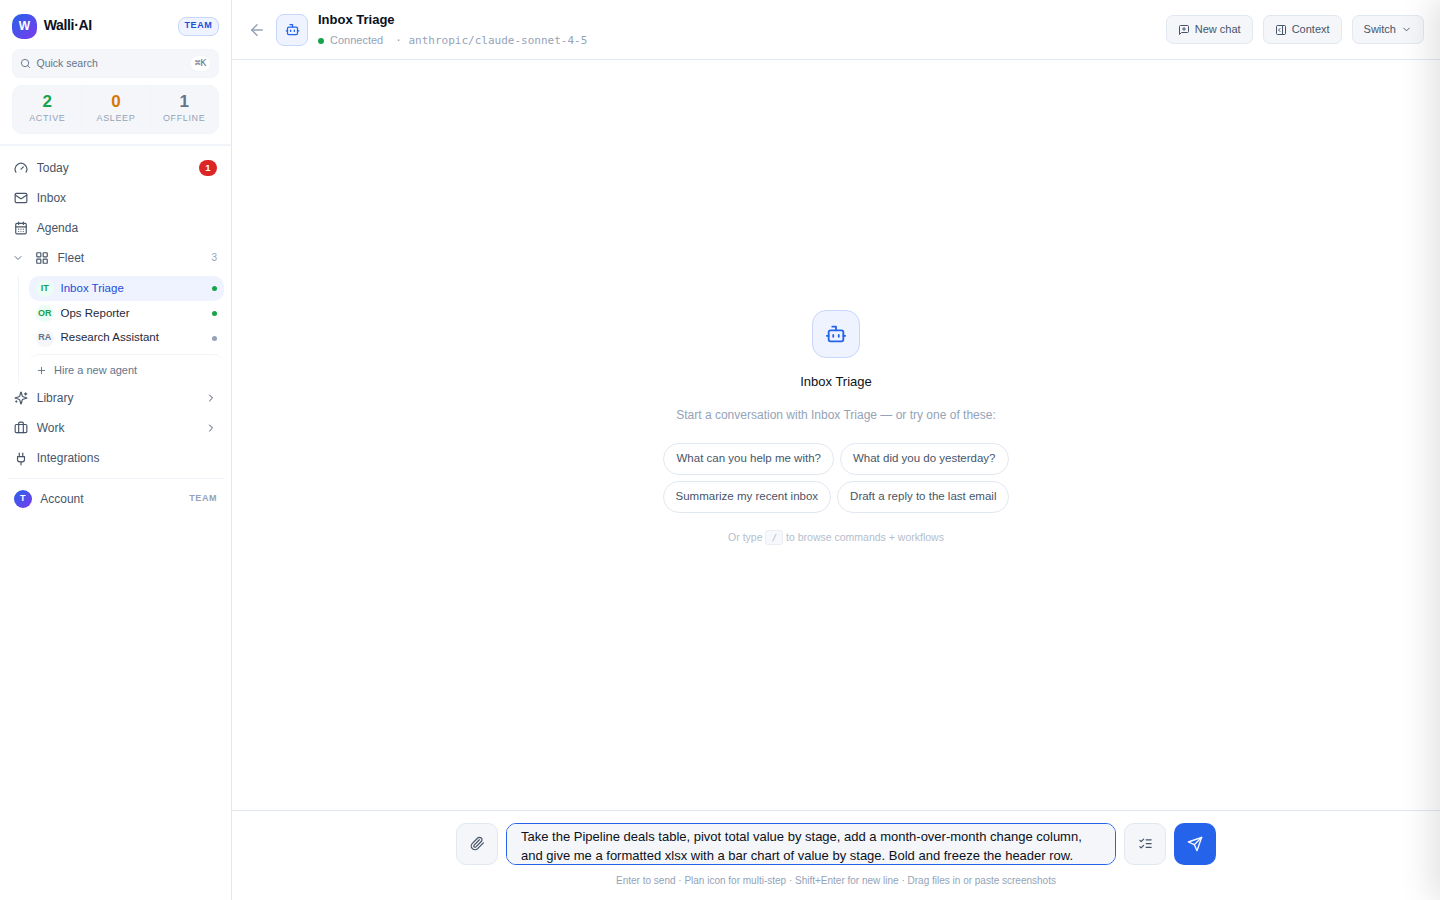
code_runtool is part of the platform tools catalog; an agent with it can run Python over data you stage in. - In the agent's chat, ask for the analysis and name the data. For example: "Take the Pipeline deals table, pivot total value by stage, add a month-over-month change column, and give me a formatted xlsx with a bar chart of value by stage. Bold the header row and freeze it." The agent stages the table into the sandbox, writes the pandas and openpyxl code, and runs it.
- The agent runs the code in the sandbox and writes the resulting
.xlsxto its output folder. The finished file is saved to your Library, and the agent links to it in the reply so you can download it. - Open the file to check the analysis, then reuse the same request whenever the data refreshes, or wire it to a schedule to run on a cadence.
What you get
A formatted xlsx you can download and forward: the computed pivot, the derived columns, the totals, and the chart, laid out with the header formatting you asked for. Because the numbers are produced by Python running over your actual rows, they are real computed values, the same arithmetic every time, not figures a language model estimated. The agent shows you the code it ran and links the output file, so the analysis is reproducible and auditable rather than a black box.
One thing to understand about the sandbox, because it shapes what this recipe can and cannot do: the sandbox has no internet. The code cannot call an external API, fetch a web page, or reach your internal systems. It works only on the data you stage in (the table rows or the uploaded file) and produces files out. That isolation is deliberate: it is what makes it safe to run agent-written code over your data. So this recipe is for analyzing and reshaping data you already have, not for enriching it from an outside source.
Make it yours
- From an uploaded file. Drop a raw CSV or xlsx export into the agent's workspace and point the request at the file instead of a table, when the data is not in Walli-AI yet.
- A recurring analysis. Put the same request on a schedule so the formatted report regenerates every week or month as the underlying data grows.
- A different deliverable. Ask for a CSV, several sheets in one workbook, or a set of chart images instead of a single formatted xlsx, depending on what the recipient needs.
- Chart-heavy or table-heavy. Steer the output toward the visuals (a page of charts for a readout) or toward the numbers (clean pivot tables for someone who will work with them), by saying so in the request.
What it costs
This recipe is one agent run plus a short sandbox execution. The agent reasons about your request and writes the code, and the sandbox runs it for a bounded slice of time; both are metered. If the agent runs on Walli-AI's managed Spark models, its reasoning is metered against your plan's included AI budget, which you can watch fill in real time, and the sandbox compute is metered per run. Run the agent on your own provider key and its reasoning bills to your provider instead. The plan you need depends on how many agents and seats you want. See what it costs and choosing a plan.