Governance: spend, activity, and the audit trail
See what your agents spent and did, act on runs that need attention, and inspect a filterable tool-call audit trail.
Governance is where you answer three questions about your fleet: what did it cost, what did it do, and who did what. The Governance page (/audit) has two tabs. Overview is an operational dashboard of spend and run activity with buttons to act on anything stuck. Data access is a chronological audit trail of every tool call an agent made through Walli-AI. This article walks both tabs and then explains how autonomy grants and learned trust decide how much an agent can do on its own before it needs your sign-off.
What you can do
- See total spend, run counts, success rate, and pending approvals for a time window.
- Break spend down by agent and see which integrations each one touched.
- Review, retry, or acknowledge runs that need attention, without leaving the page.
- Inspect a filterable, timestamped log of every Walli-AI tool call, including failures.
- Understand how much autonomy each agent has and how it earns more.
Open Governance
Open the avatar menu and choose the governance entry, or go to /audit. The page opens on the Overview tab; the Data access tab is one click away.
Overview: spend and activity
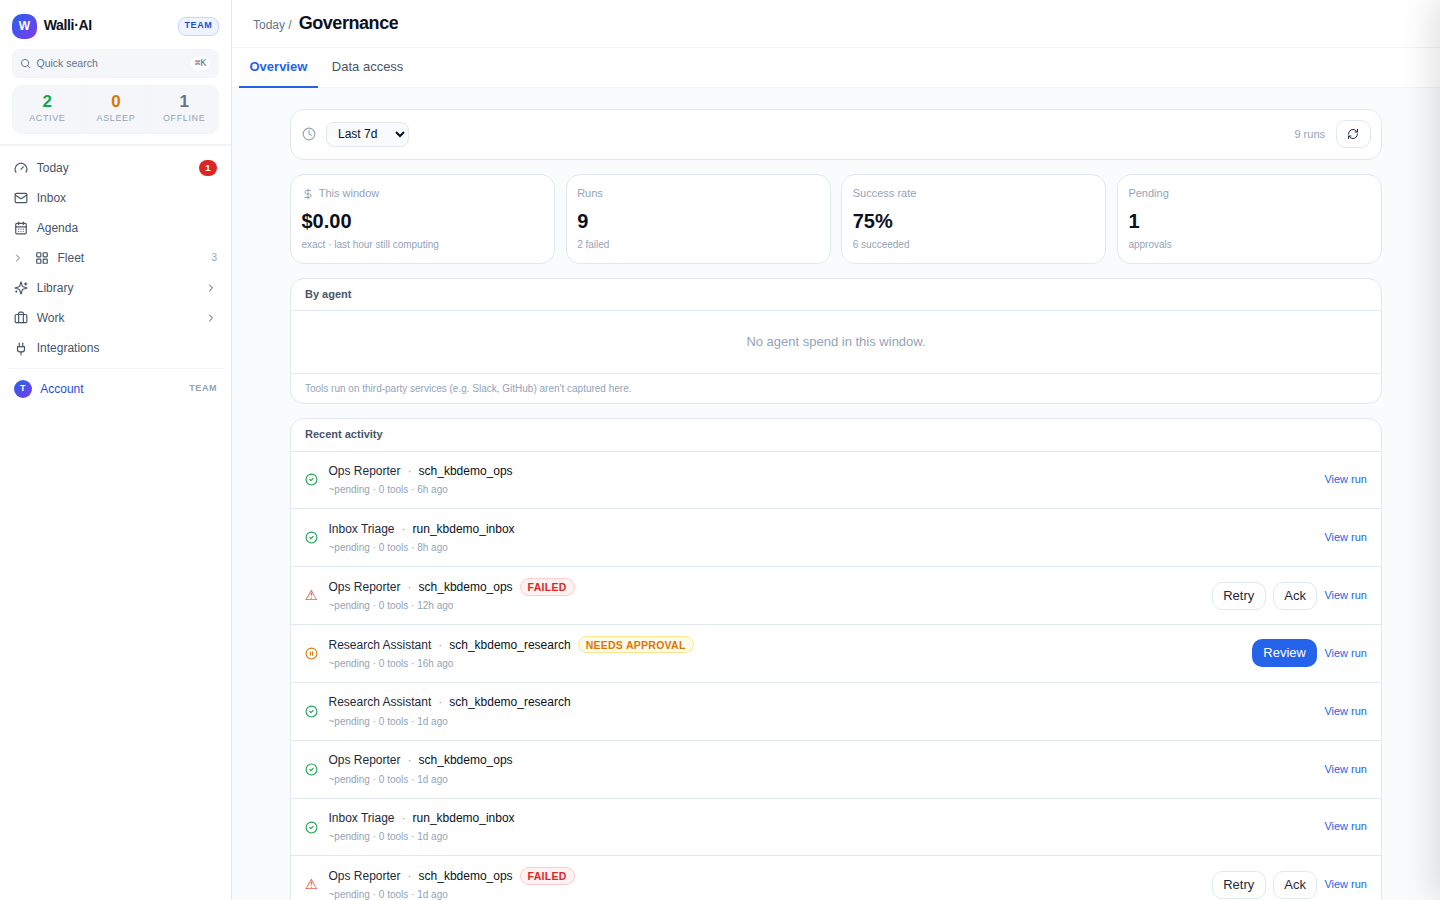
The Overview tab reads a live model of your fleet's runs and cost. A window selector at the top switches between Last 24h, Last 7d (the default), and Last 30d; a refresh button re-pulls the data.
Four summary cards sit across the top:
- This window. Exact spend for the selected window. If the most recent hour is still being metered, the card notes that the last hour is still computing so you know the figure will tick up slightly.
- Runs. How many runs happened in the window, with the failed count beneath.
- Success rate. The percentage that succeeded, with the succeeded count beneath.
- Pending. How many runs are waiting on your approval.
Below the cards, the By agent table lists each agent's run count, its spend, the integrations it touched (Slack, GitHub, and so on), and when it last ran. Click any agent row to filter the activity feed to just that agent; a Clear filter link brings everything back. A footnote is honest about a limit: work an agent does directly on a third-party service is not captured as spend here, because that cost lives with the third party, not with Walli-AI.
The Recent activity feed is the actionable part. Each entry shows the agent, the run label, a status glyph, an estimated per-run cost, the number of tools it used, and how long ago it ran. Runs that need you carry a badge and a button:
- Review appears on a run that needs approval; clicking it approves the run.
- Retry appears on a failed run that came from a schedule; clicking it re-queues that schedule.
- Ack appears on a failed run; clicking it acknowledges the failure so it stops drawing your eye.
- View run opens the full run in the Library for any entry.
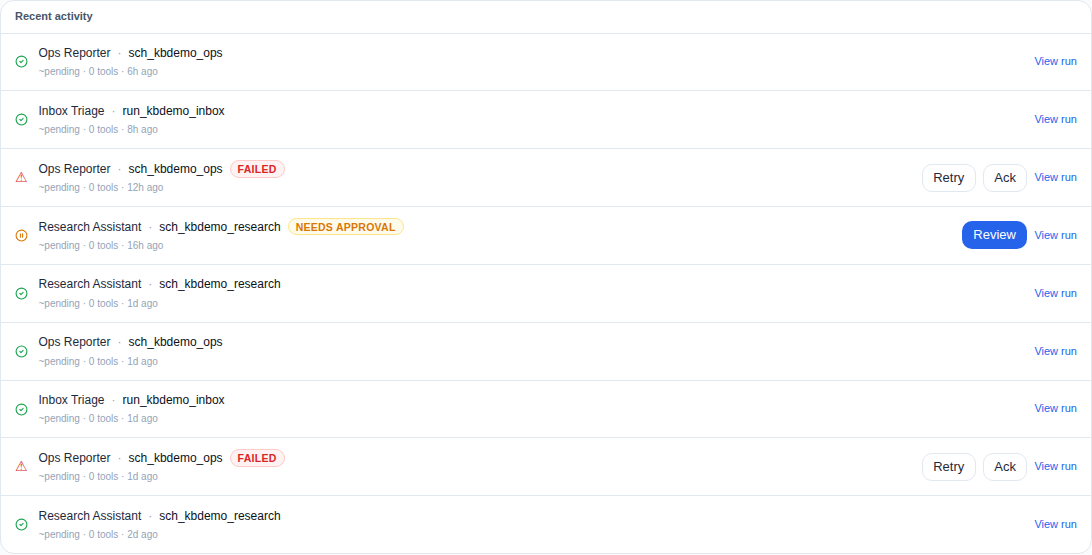
Because the estimated per-run cost is derived by splitting an agent's hourly cost across its runs, it is marked as an estimate; the summary cards at the top are the exact figures.
Data access: the audit trail
The Data access tab is the compliance-grade record. Every time an agent invokes a Walli-AI tool, a row is written, and this timeline shows them newest first. Three filters narrow it:
- Time window. Last 1h, 24h (default), 7d, 30d, or All time.
- Agent. All agents, or one specific agent.
- User. All users, or one teammate, so you can see what was done on a given person's behalf.
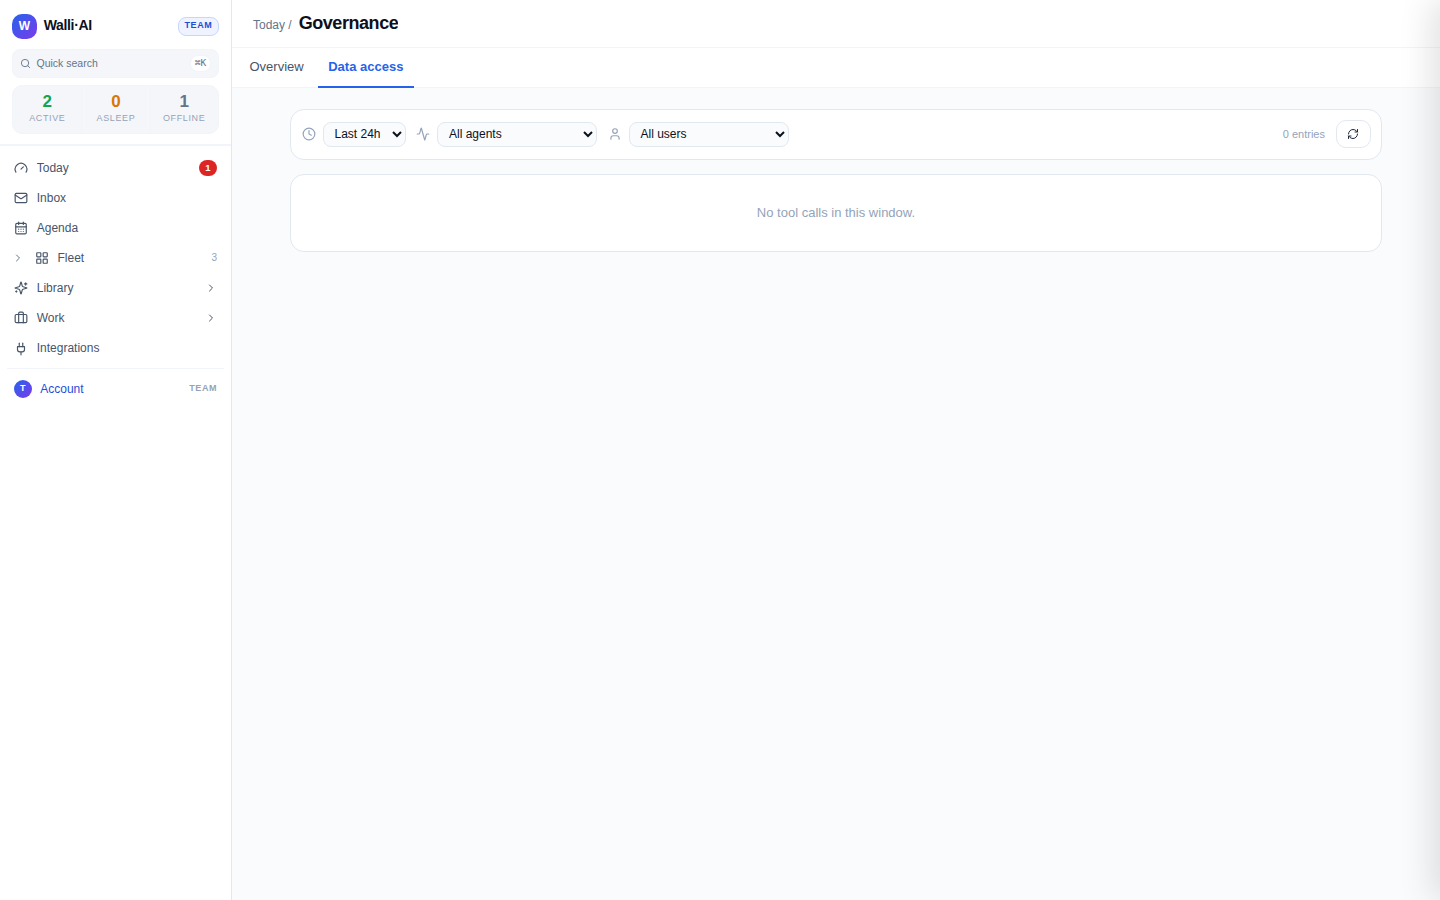
Each row names the tool as server.tool_name (the same identifier that appears in logs, so power users can cross-reference), the agent it ran on, and the actor it ran for, with a small badge for how that actor was attributed. A green dot means success; a red dot means an error, and the row expands the error message and code so a failure is diagnosable on the spot. Duration is shown on the right.
One boundary is worth stating plainly: only tools that run through a Walli-AI Lambda are logged here. Calls an agent makes directly to a third-party service (for example a Slack or GitHub MCP that runs outside Walli-AI) do not pass through this pipe and so do not appear. That is a documented constraint of where the log sits, not a gap in coverage.
On a demo or low-traffic workspace, either tab can be sparse or empty simply because few runs and tool calls have happened yet. The controls and columns are the same; they fill in as your agents work.
Autonomy grants and learned trust
Governance is not only about looking back; it is also about deciding how much an agent may do before it asks. That control lives on the autonomy matrix at /settings/autonomy, a grid of your agents against the kinds of decisions they make: approving deliverables, handling run failures, scheduling follow-ups, tuning and creating workflows, enabling integrations, adjusting schedules, and (for your coordinator) delegating and coordinating.
Each cell offers three levels:
- Ask me first. The agent proposes and waits for you. This is the default for everything, and today it is the level in force for every agent.
- Act + tell me. The agent acts on its own and reports what it did, with one-click undo.
- Full autonomy. The agent acts without stopping to report each time.
The higher two levels are rolling out and not yet fully enforced, and the matrix says as much on the page. You can set a grant now to record your intent, but until enforcement is live every agent still asks first.
The design is for you to override a level by urgency, so an agent might act on routine items but always ask on anything marked urgent. As you watch an agent behave well in the Governance feed, you raise its level; if it oversteps, you lower it. That feedback loop, granting more rope as an agent proves reliable, is what "learned trust" means in practice: trust is something the agent earns through demonstrated behavior, and you hold the dial.
Tips
- Start on the Last 7d window for a balanced picture, then widen to 30d when you are chasing a cost trend.
- Click an agent row in the By agent table to pin the activity feed to that agent; it is the fastest way to investigate one noisy agent.
- Use the User filter on the audit trail when you need to see everything done on one teammate's behalf, for a review or an incident.
- Raise autonomy one notch at a time and watch the Governance feed before going further; the undo on Act + tell me makes that safe.