Insights: what the platform noticed about your fleet
The platform watches your fleet and surfaces patterns worth your attention. Act on them from Today, and audit the full 14-day history on the Insights page.
Insights are the platform's proactive read on your fleet. As your agents run, a background finder studies their runs, costs, schedules, and outcomes and raises a flag when it spots something worth your attention: an unusual result, a rising trend, two schedules colliding, a bill climbing faster than usual. You act on live insights from Today, where they arrive as decision cards, and you review the full history on the Insights page (/insights). This article explains each insight type in plain terms and how to act on, snooze, or dismiss it.
What you can do
- See what the platform noticed, ranked by how much it matters, on Today.
- Act on an insight, snooze it for a while, or dismiss it.
- Audit every insight from the last 14 days on the Insights page.
- Filter the history by status, severity, and type, and see which types fire most.
The insight types, in plain terms
Every insight has a type that tells you what kind of pattern was found. The finder produces these:
- Anomaly: a run behaved unusually against its own history, for example a result that is far larger or smaller than normal.
- Trend: a metric is moving steadily in one direction, such as inbound email volume climbing week over week.
- Overlap: two agents or schedules are doing overlapping work, for example two report workflows firing in the same window so approvals stack up.
- Follow-through: a recommended next step from an earlier run was never picked up, so a loop is still open.
- Tool gap: an agent keeps needing a tool or integration it does not have, a signal to connect one.
- Schedule conflict: two schedules on the same agent overlap in time.
- Cost spike: spend on an agent or the fleet jumped noticeably. This one is computed deterministically from real cost numbers, never estimated, so the figure you see is the figure you were charged.
- Quality regression: an agent's graded output quality slipped over recent runs. Like cost spikes, it is derived from real critique scores rather than guessed.
Each insight also carries a severity: urgent (amber), watch, or info. Higher severity means it surfaces more prominently and sorts higher on Today.
Act on insights from Today
Live, active insights do not wait on the Insights page for you to find them; they come to you on Today as cards in the Decisions for you queue.
- A watch-level insight lands in Needs you; an info-level insight lands in When you have a minute. The card names the agent, states the pattern, and gives the platform's recommended response.
- Act with the card's buttons. On it marks the insight acted on and records that you agreed the pattern was worth addressing. Snooze hides it for 3, 7, or 30 days. Dismiss clears it and tells the finder this type was not useful here.
- Use Why this? on the card to see which agent and signal produced it before you decide.
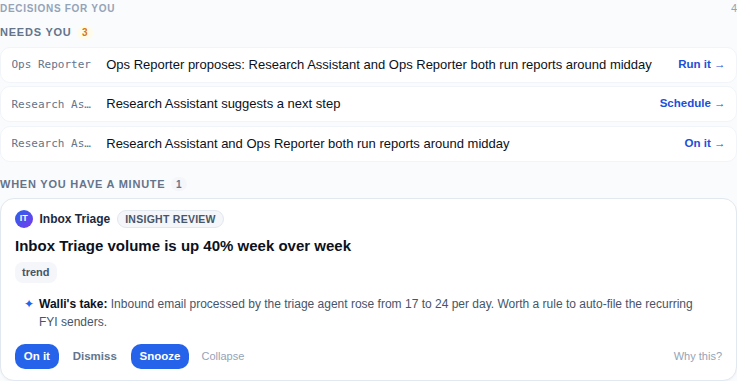
Because acting, snoozing, and dismissing all feed the finder, the platform learns which insight types you value and which you keep waving off, and tunes what it surfaces accordingly.
Audit the full history
The Insights page (/insights) is the accountability trail: every insight the finder produced over its 14-day retention window, whatever its current status. Open it from the sidebar under the intelligence area.
- A stats card at the top summarizes the set: Total, and counts for Active, Snoozed, Dismissed, Acted on, and Urgent. Below it, the page calls out the most-flagged type and, when a type is dismissed repeatedly, suggests muting that source.
- A filter row lets you narrow by Status (Active, Snoozed, Dismissed, Acted on), Severity (Urgent, Watch, Info), and Type. The type chips are built from the insights you actually have, so you only ever filter by types that exist.
- Each row shows the type with an icon, severity and status pills, when it was proposed, the title, the body, and an Open in chat link that carries the insight into a conversation with the agent it concerns so you can dig in or ask for a fix.
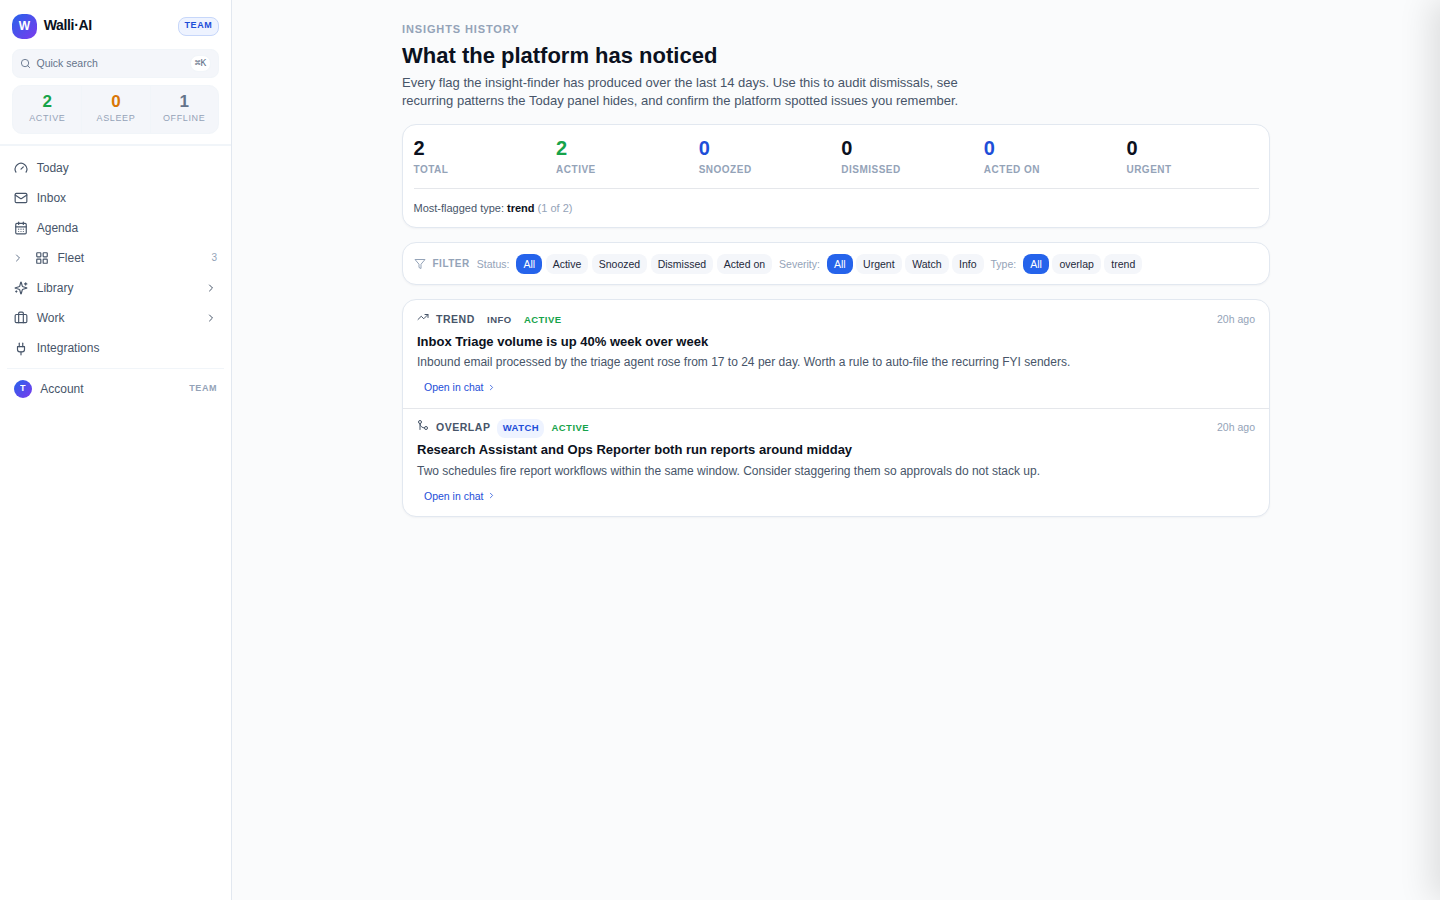
The demo tenant used for these screenshots has two active insights, an overlap (watch) and a trend (info), which is why the history shows two rows and the counts read two total, two active. On your own fleet the list grows as agents accumulate runs to learn from; a brand-new tenant sees an empty state that points you to set up agents, schedules, and workflows so the finder has activity to study.
Tips
- Treat the Today cards as your working queue and the Insights page as your audit log: act live, review history when you want the fuller picture.
- If a type keeps firing on things you do not care about, dismiss it a few times; the page flags a heavily dismissed type and the finder backs off.
- Cost spike and quality regression are grounded in real numbers and scores, so when one appears, the figure is trustworthy and worth a look.
- Use Open in chat to turn an insight into action immediately by asking the agent that raised it to address the pattern.