Data and reporting
Agents are only as useful as what they can read and write. This is the structured data layer underneath them, and it is a real database rather than a spreadsheet widget.
Structured data your agents can actually use.
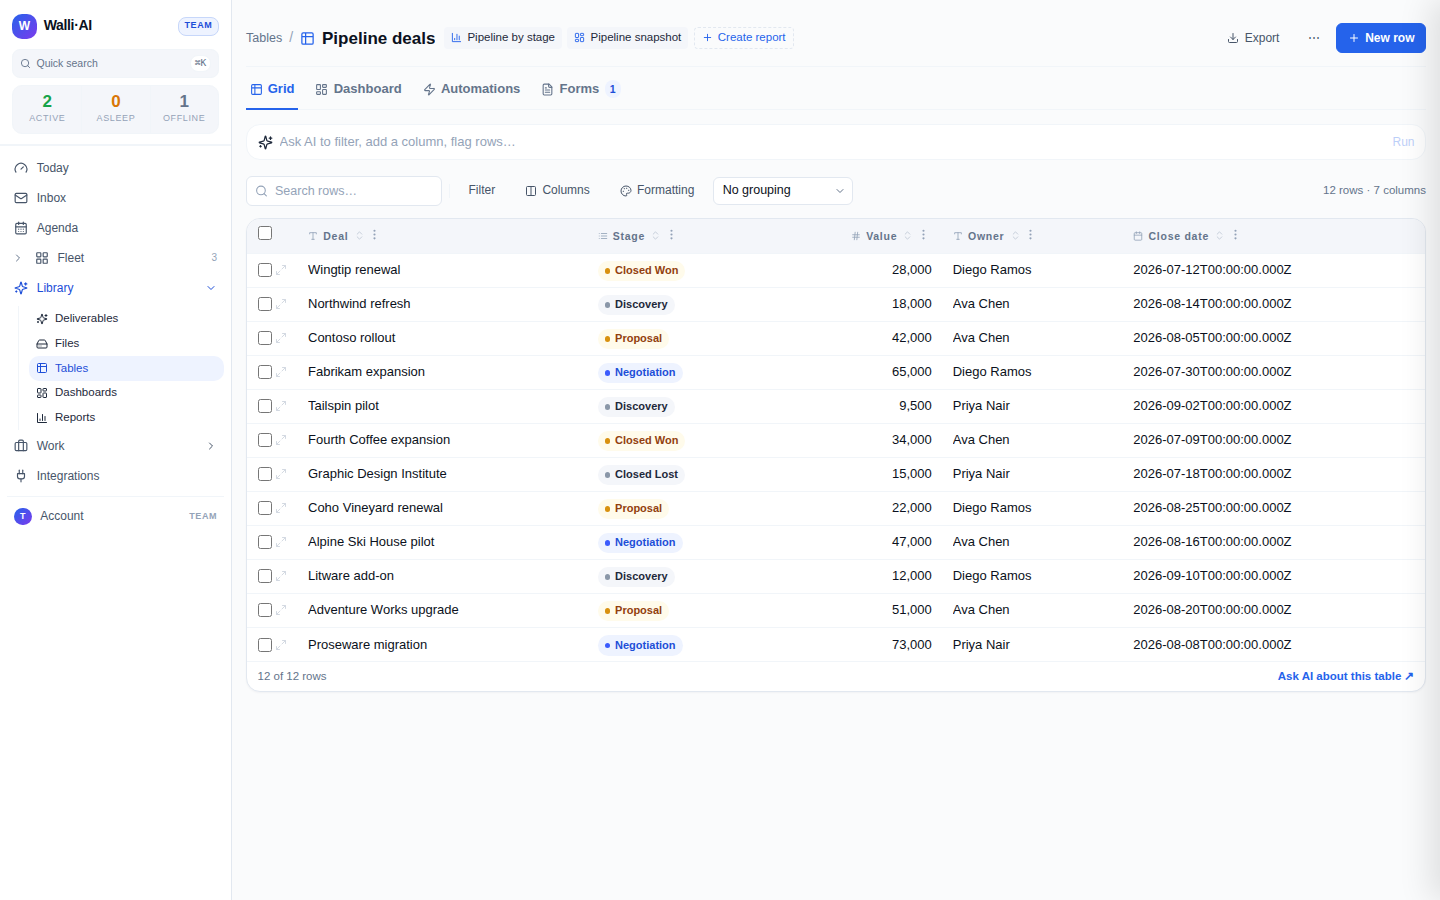
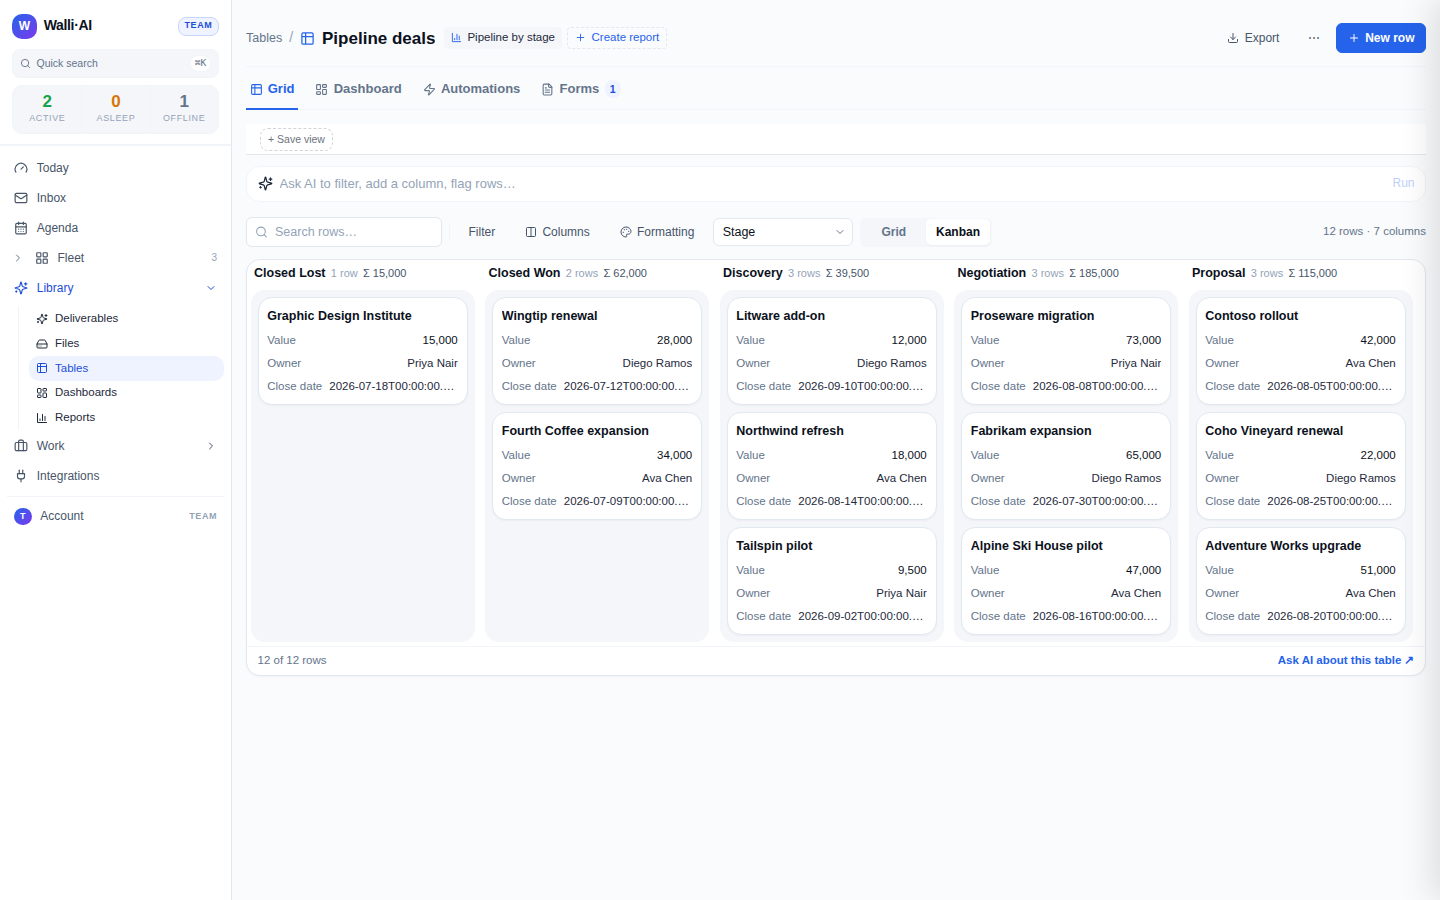
Tables have typed columns, so a date is a date and a number is a number. Rows in one table can point at rows in another, and you can pull fields across that link, roll up totals from related rows, and compute values with formulas. You can group the grid into sections, switch it to a kanban board, filter and sort it, save that arrangement as a view, and colour rows by rule.
Underneath, this runs on a relational database that scales to nothing when you are not using it, so an idle workspace is not quietly costing anyone money.
Four ways, none of them retyping.
By hand
Edit the grid directly, or open a single row in a side panel with every field, its linked records, and the history of what touched it.
By import
Load a CSV to create a table or add to one, with a summary of what came in and what could not be coerced.
By form
Publish a public form so people outside your workspace can submit rows. You choose which fields to expose and cap how many submissions a day you will accept.
By asking
Tell an agent to log something and it does. You can also filter, add columns, and flag rows from the grid by typing what you want in plain English.
A row changing can start work.
Wire a table to an agent and inserting, updating or deleting a row can run a workflow or send that agent a message. A scheduled sweep can do the same for every row matching a condition. This is how a new lead gets enriched automatically, or a support request logged from a chat channel becomes a tracked row without anyone copying anything.
The AI decides what the report says. Arithmetic decides the numbers.
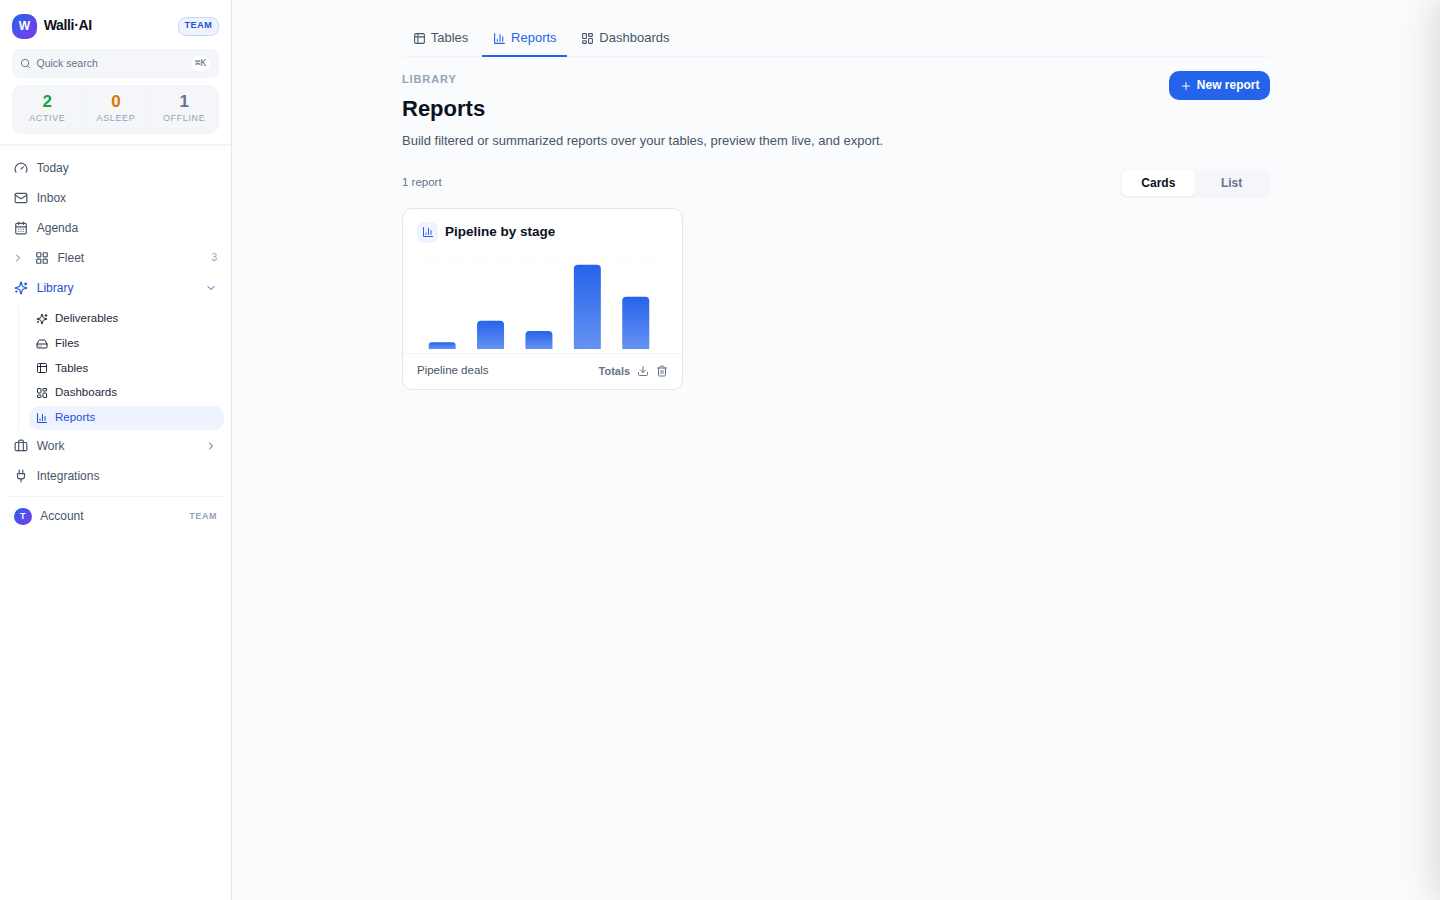
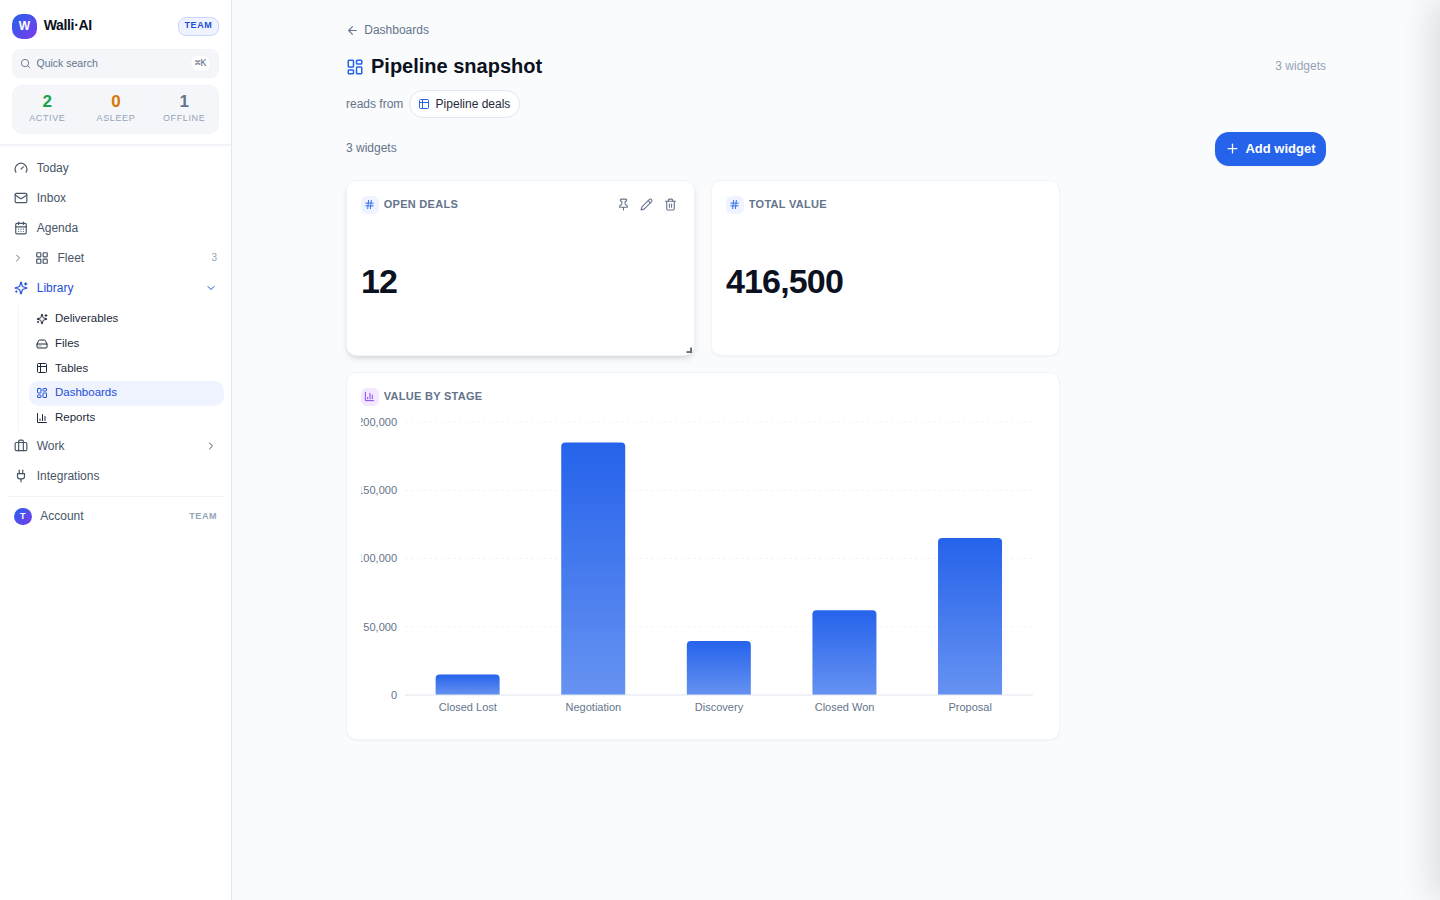
A report is built over your tables: pick your rows or your totals, choose columns, filter, group, aggregate, join a linked table, and chart the result. Every figure in it is computed by a deterministic engine reading your actual data.
No number in a report is generated by a language model. This is the single most important design decision in the product, and it is why a Walli-AI report is something you can take into a board meeting.
Documents, and everything your agents produce.
Knowledge
Upload your documents and agents answer from them, with the relevant passage retrieved per question. An agent grounded this way says it does not know rather than inventing an answer. Your documents stay isolated to your workspace.
Files
Everything an agent produces lands in a library you can browse, preview, download and organise, alongside anything you have uploaded yourself.
But can you trust what comes back?
Deterministic reports are one instance of a wider rule. Here is the rule.
How output gets checkedAll areas